Our Expectations for the Future
The multi-state metropolitan region of which the NYMTC planning area is part has one of the oldest, most complex, and highly used transportation networks in the world.
On a typical weekday in 2019, the region's multimodal transportation network handled more than five million passenger trips and thousands of tons of freight shipments.
Notably, public transit mode share on this network is the highest in the United States, accounting for nearly 40 percent of all transit trips taken in the country, which is a testament to the scale of the public transit components of the network. Read Chapter 2: How Transportation Planning Happens (Open in a new window)
The transportation system includes both the federally supported transportation system and the facilities of five self-financed public authorities with jurisdiction over significant system components that are not considered part of the federally supported system, namely: the Port Authority of New York and New Jersey, the New York State Thruway Authority, the New York State Bridge Authority, MTA Bridges and Tunnels (legally, the Triborough Bridge and Tunnel Authority), and the Nassau County Bridge Authority.
Continued Growth
Understanding socioeconomic trends is an essential step to forecasting travel demand or use of the regional transportation system. NYMTC's socioeconomic and demographic forecasts establish the likelihood that the multi-state metropolitan region will experience significant growth in population, jobs, economic activity, and travel over the planning period. This likelihood presents a challenge to the regional transportation system and highlights the importance of accommodating future growth while safeguarding the quality of life and health of residents and visitors.
At this writing, the COVID-19 pandemic, whose impacts in the forecasting region were first felt in March 2020, has significantly disrupted growth trends. While adjustments have been made to the forecasts to reflect this short-term impact and resulting economic uncertainty, the ongoing conditions and effects of the pandemic are largely speculative. Nonetheless, the primary purpose of the forecast is the long-term outlook, which is less suspectable to short-term volatility. As new data become available regarding the impacts of the pandemic on regional employment and population trends, they will be incorporated in the next set of socioeconomic forecasts.
Socioeconomic and Demographic Forecasts for the NYMTC Planning Area
Use checkboxes to show desired demographic data
Population
- 2017 12.82 million
- 2050 14.13 million
- Percent Change 2017-2050 10.23%
Employment
- 2017 7.08 million
- 2050 8.07 million
- Percent Change 2017-2050 13.95%
Civilian Labor Force
- 2017 6.50 million
- 2050 7.22 million
- Percent Change 2017-2050 10.99%
Average Household Size
- 2017 2.75
- 2050 2.71
- Percent Change 2017-2050 -1.38%
Among the NYMTC subregions, Long Island is expected to have the highest rate of growth in population and civilian labor force, increasing by 11.7 percent and 12 percent, respectively. New York City is forecast to experience the highest rate of job growth and add the highest total numbers for all indicators except average household size, adding more than 850,000 to its population, more than 770,000 jobs, and 300,000 more people to the civilian labor force. Average household size is expected to decrease for all three subregions and will shrink by 1.38 percent across the NYMTC planning area from 2.75 to 2.71 household members.
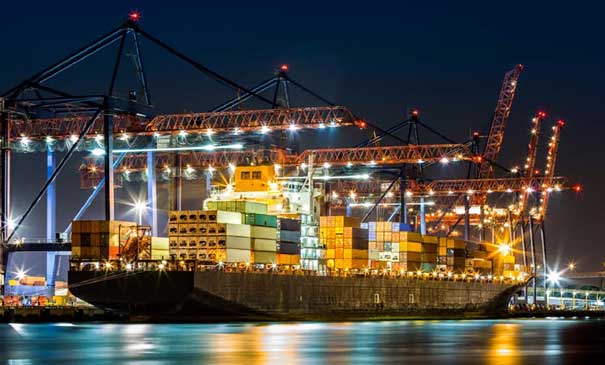
Meanwhile, more than 300 million tons of domestic freight worth more than $430 billion moves into, out of, and within the NYMTC planning area by truck, rail, water, air, and pipeline annually; around 18 million tons of international freight worth $211 billion is imported to and exported from the NYMTC planning area annually. Trucks are responsible for moving more than 92 percent of domestic tonnage and nearly 88 percent of domestic value. Around 61 percent of tonnage and 65 percent of value is moving inbound to the NYMTC planning area; around 19 percent of tonnage and 18 percent of value is moving outbound; and the remainder is moving between or within NYMTC counties. The NYMTC planning area is expected to gain another 127 million tons of domestic freight worth nearly $300 billion by 2045 and experience substantial growth in international freight.
Transformational Changes
During the planning period, it is likely that technological, behavioral, economic, and environmental changes, the beginnings of which are evident today, will affect the region's overall mobility. Some of these changes will be the result of, or be accelerated by, the COVID-19 pandemic. Others have been underway and will carry forward once the pandemic is over. These trends have the potential to transform the nature and means of travel for people and goods in the multi-state metropolitan region.
Consequently, the development of the Plan considered the potential effects on transportation of numerous transformational changes, including shared mobility, mobility-as-a-service, e-commerce, distributed manufacturing, climate change and extreme weather events, energy transformation, changing demographics and lifestyle/workstyle expectations, and changing land use patterns.
Transformational changes and the future of mobility will influence Moving Forward's strategic framework. Some possible outcomes will likely influence how NYMTC as an organization and its members individually seek to fulfill the goals of their Shared Vision for Regional Mobility. Other potential outcomes, such as evolving forms of shared mobility, will affect the way these goals are pursued. Moving Forward attempts to lay the groundwork for anticipating these developments and formulating approaches. However, greater attention will be needed going forward to better understand current trends, potential futures, and possible outcomes.